- Milk Road Crypto
- Posts
- 🥛 PRO | Are you ready for Appcoin season? 📈
🥛 PRO | Are you ready for Appcoin season? 📈
Last call to revisit your portfolio 📢
m0xt _
July 19, 2025
GM, this is Milk Road PRO, the ‘Lego instruction booklet’ of crypto newsletters (we help you build your portfolio, brick-by-brick.)
Apps are eating blockchains.
At least when it comes to making money. And if you are an investor, that’s all that matters. Now more than ever.
Why? Because our macro outlook for the months ahead is bullish and that could set the stage for a strong run in altcoins.
But with tens of thousands of tokens out there, don’t expect them all to move the same way.
👉 We believe the apps pulling in millions in revenue are in the best spot to ride the next “altcoin” season.
Or maybe we should call it something else entirely: how about “appcoin” season?
Because there’s a big difference between apps that are shipping real products and generating revenue... and tokens just waiting around for the next wave of hype to pump their bags.
Investors in real, revenue-generating apps don’t need to hope or pray for price pumps.
They’re following a tried-and-true strategy: invest in businesses that make money and are likely to make even more over time.
It’s that simple.
Last cycle, blockchains stole the spotlight and saw massive gains.
But this time? There's a real chance it’s the apps that take center stage. In fact, the trend is already taking shape.
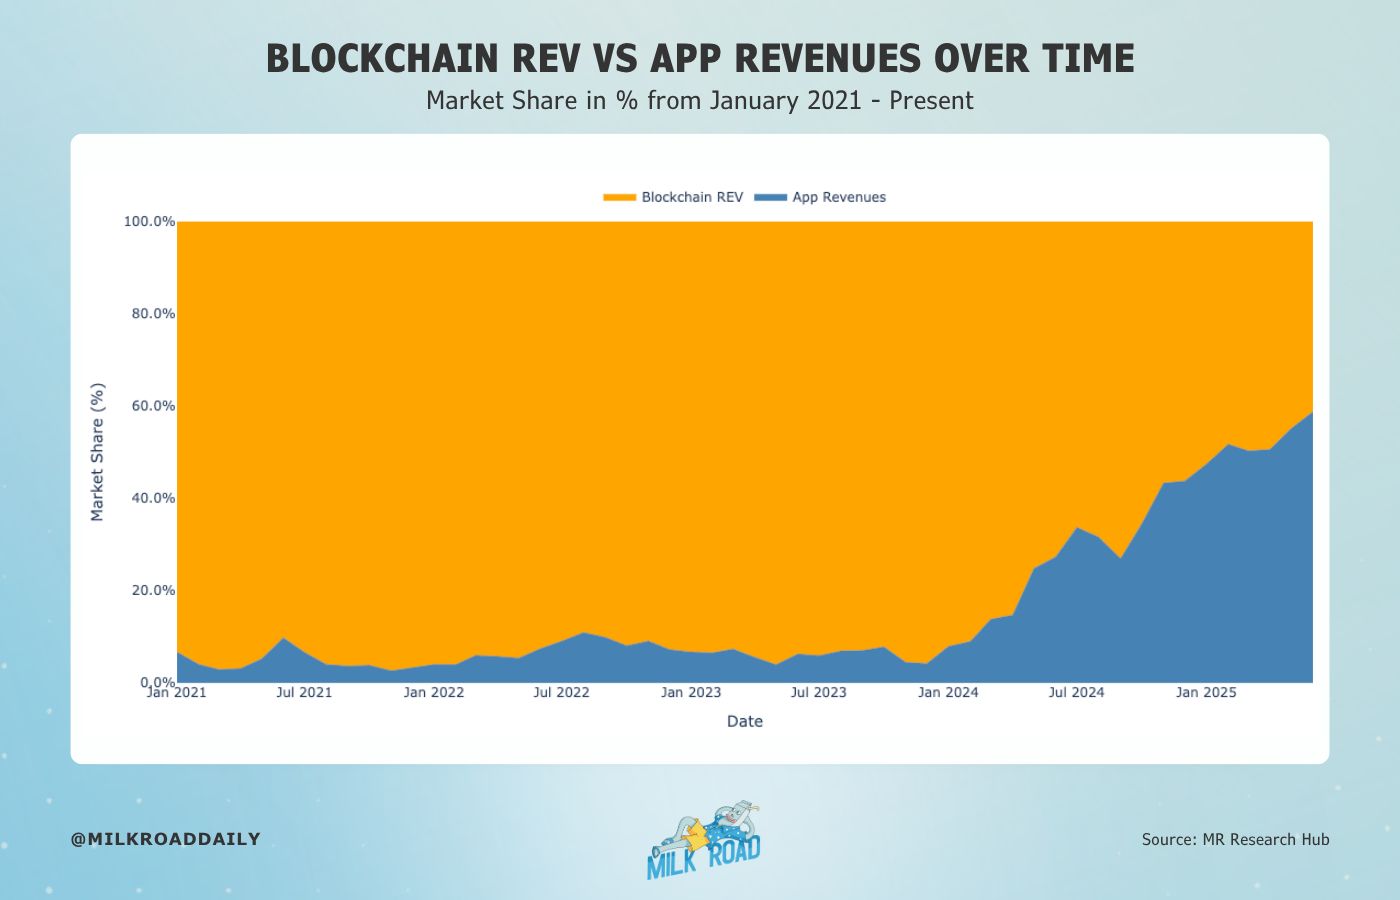
Source: MR Research Hub
Apps have been gaining real momentum since the start of 2024, and they're now generating more revenue than the blockchains they run on.
At the moment, apps account for 63% of total revenue, while blockchains make up the remaining 37%.
The trend has cooled a bit in recent weeks, but we believe the coming month could kick off another wave of app dominance and push that number even higher.
We broke down the reasoning behind this in our recent report here.
But to save you time, here’s one chart that says it all.
A lot of people are bullish on Bitcoin right now. So are we.
And when $BTC moves up, onchain app revenues tend to follow.
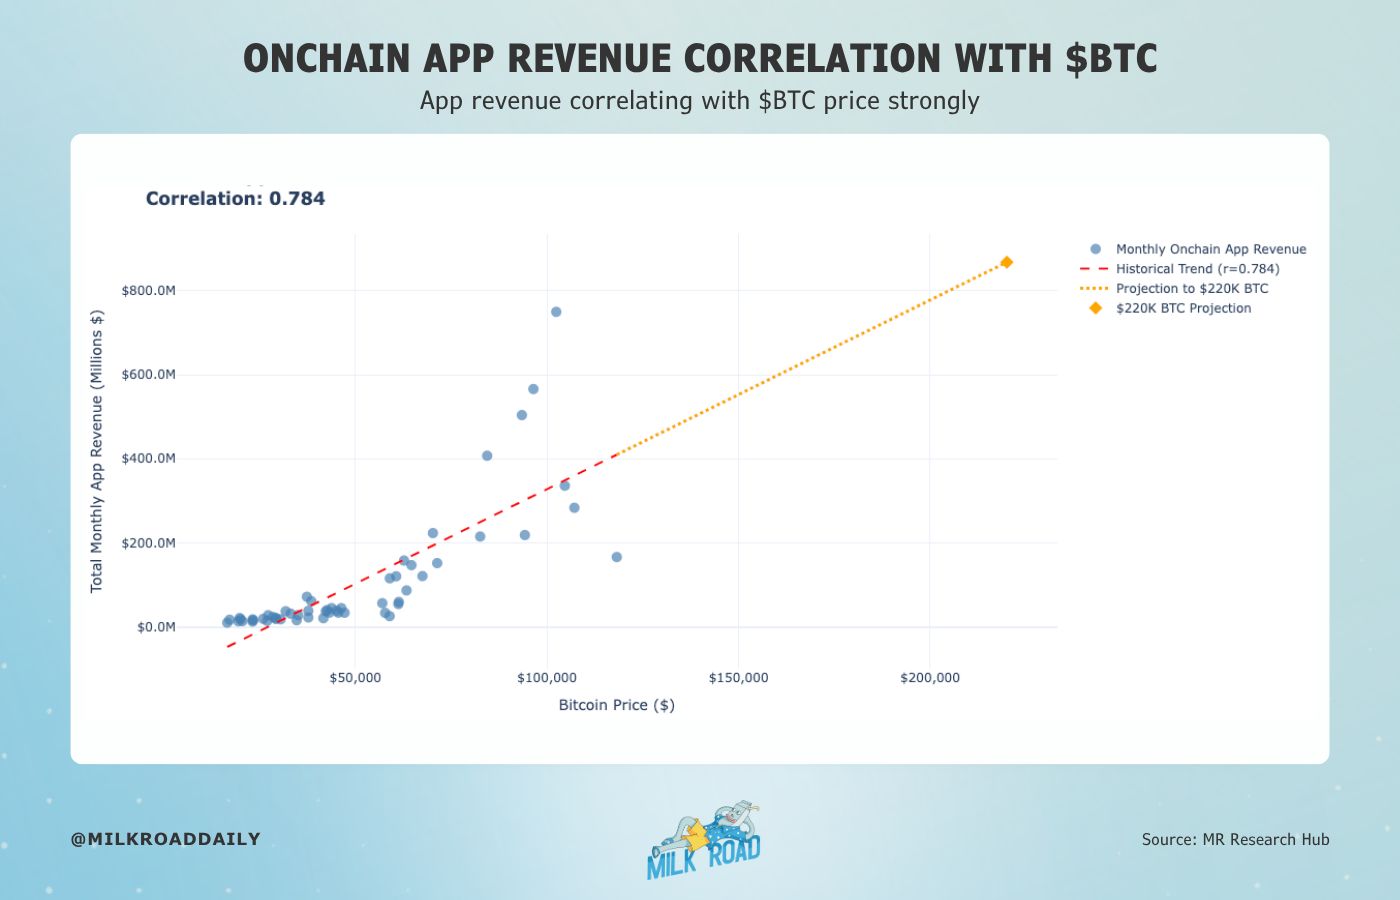
Source: MR Research Hub
Bitcoin and onchain app revenues move closely together. The correlation sits at 0.784, which is pretty strong considering a perfect correlation is 1.
If we just extend that correlating trend onto higher Bitcoin prices (see x-axis), we can start to get a rough idea of where app revenues might land too (see y-axis).
👉 Say $BTC doubles its previous all-time high and hits $220K — at that level, app revenues could climb to around $1.4B per month.
That’s a 4x jump from the current $350M.
So if app revenues are likely to 4x from here, it’s reasonable to expect prices could follow a similar path.
Of course, not all apps will grow at the same pace—some will scale revenue much faster than others. And those are the ones that we want to hold.
But here’s what we need to ask ourselves:
Which sectors are generating the most revenue today?
Which are growing fastest?
Can they scale and make a lot more in the future?
Which are the top apps in each sector?
Should we adjust our portfolio to catch this (app) trend?
We want to understand the full scope of this market — dive into the data, look at it through an investor’s lens, and figure out how well we’re positioned now.🤔
Altcoin Appcoin season is coming. We want to be ready!
The only question is… are you?
APP REVENUES
First, we need to define what exactly an app is in this context. Here’s how we defined apps in our previous report.
Apps = businesses that use blockchain to deliver real products or services — with a clear goal of generating revenue and maximizing profits.
It’s fairly self-explanatory.
PS: Based on that definition, platforms like Coinbase, Robinhood, Circle, and Tether would technically qualify too. But for today, we’re focusing only on crypto-native apps, so those are left out.
Now if you’re new to the space, it might not be clear how these apps can actually generate revenue or make profits.
It’s actually pretty simple. They build products or services that users pay for. And there's one more nuance to keep in mind:
There's app fees
and then there's app revenues.
Understanding the difference between the two is important, so we're going to break it down for you.
Here is an example:
You typically pay around a 0.05% trading fee. This is also known as the app fee, but only a small portion of it is kept by the app as revenue. Here’s why:
Most of that app fee (87%) goes to the liquidity providers—the ones who made the trade possible by supplying liquidity.
The rest (13%) goes to the DEX itself—the app.
Put simply: app fees are the total amount users pay, while app revenues are what the app actually keeps.
The ratio between fees and revenue—also known as margins—varies by sector.
DEXs have thin margins at around 13%. Lending protocols do better, keeping about 26%. And some trading tools capture nearly 100% of the fees.
To put things in perspective, here’s what the aggregated margins look like over time.
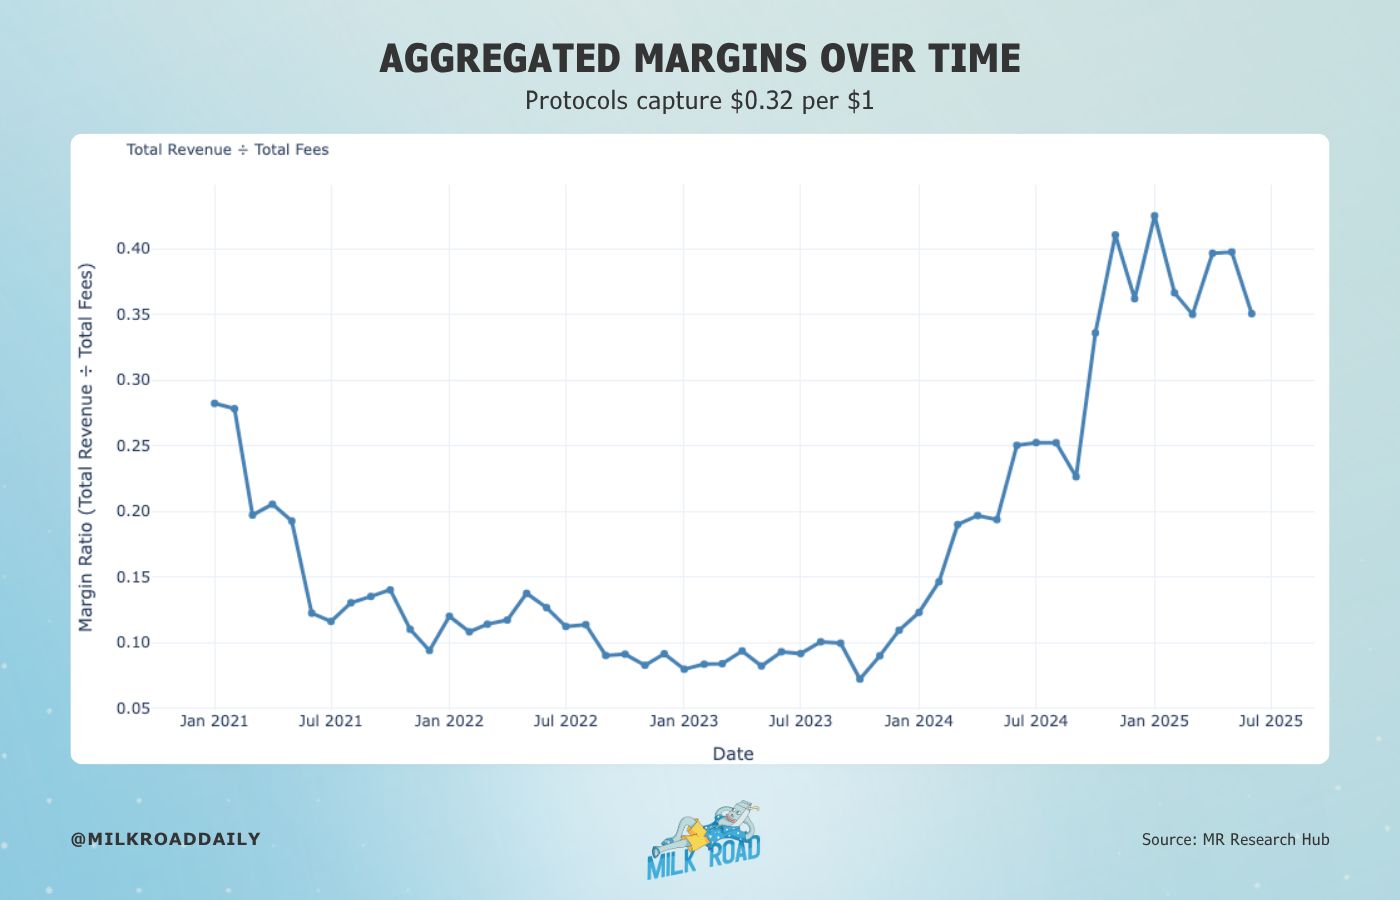
Source: MR Research Hub
You can see that the average margins are at 32%. In other words, for every $1 spent in fees using an app, the protocol typically keeps around $0.32.
The remaining $0.68 is distributed to other participants in the ecosystem like liquidity providers, lenders, validators etc... But we’ll dive deeper into margins for each sector a bit later.
Now that we understand app revenues, let’s take a look at how they’ve evolved over time.
Source: MR Research Hub
Since April 2024, app revenues have been holding steady at around $350 million a month.
That’s a solid floor to build from.
Let me explain:
If you're investing in apps, your decision is mostly driven by their current and future revenue potential.
And when we look at the bottoming pattern in app revenues over the past 18 months, it tells us something important:
It suggests we’ve likely seen the worst.
App revenues probably won’t fall much lower than where they've been in the last year and a half.
That’s what we mean when we say it gives us a strong baseline.
We’ve already made the case for why app revenues could 4x from here. But to really take advantage of that growth, we need to dig deeper and identify the most promising sectors and spot the leaders.
👉 Because odds are, the leaders will keep leading. And when revenue rises, it’s usually the top players setting the pace.
To do that, we’ll be using data from Blockworks, as they provide well-labeled views of all the key app categories along with detailed revenue data.
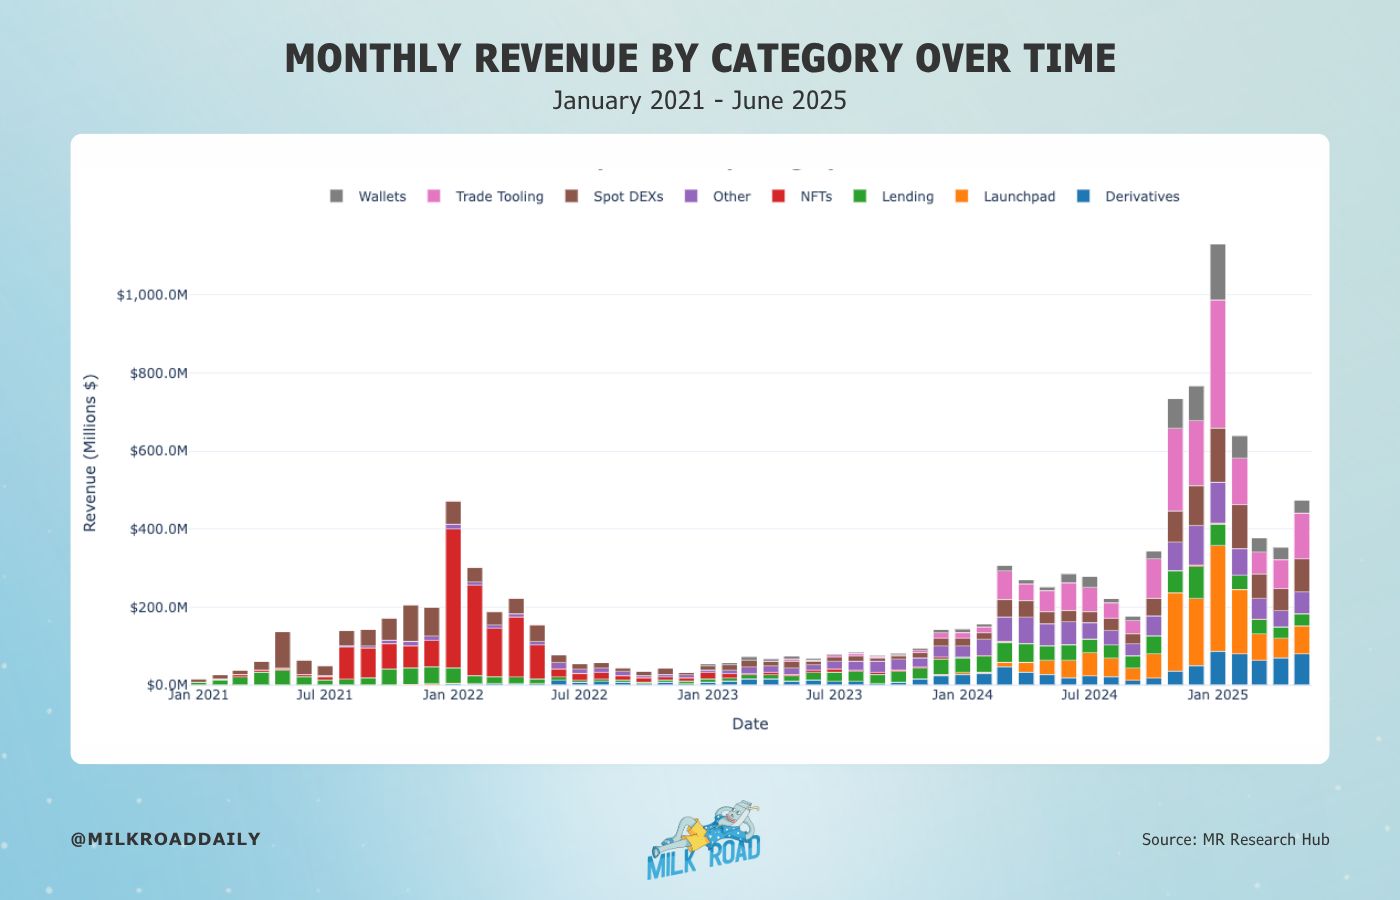
If we zoom in, we can look at which sectors are grabbing the biggest share of the app revenue today.
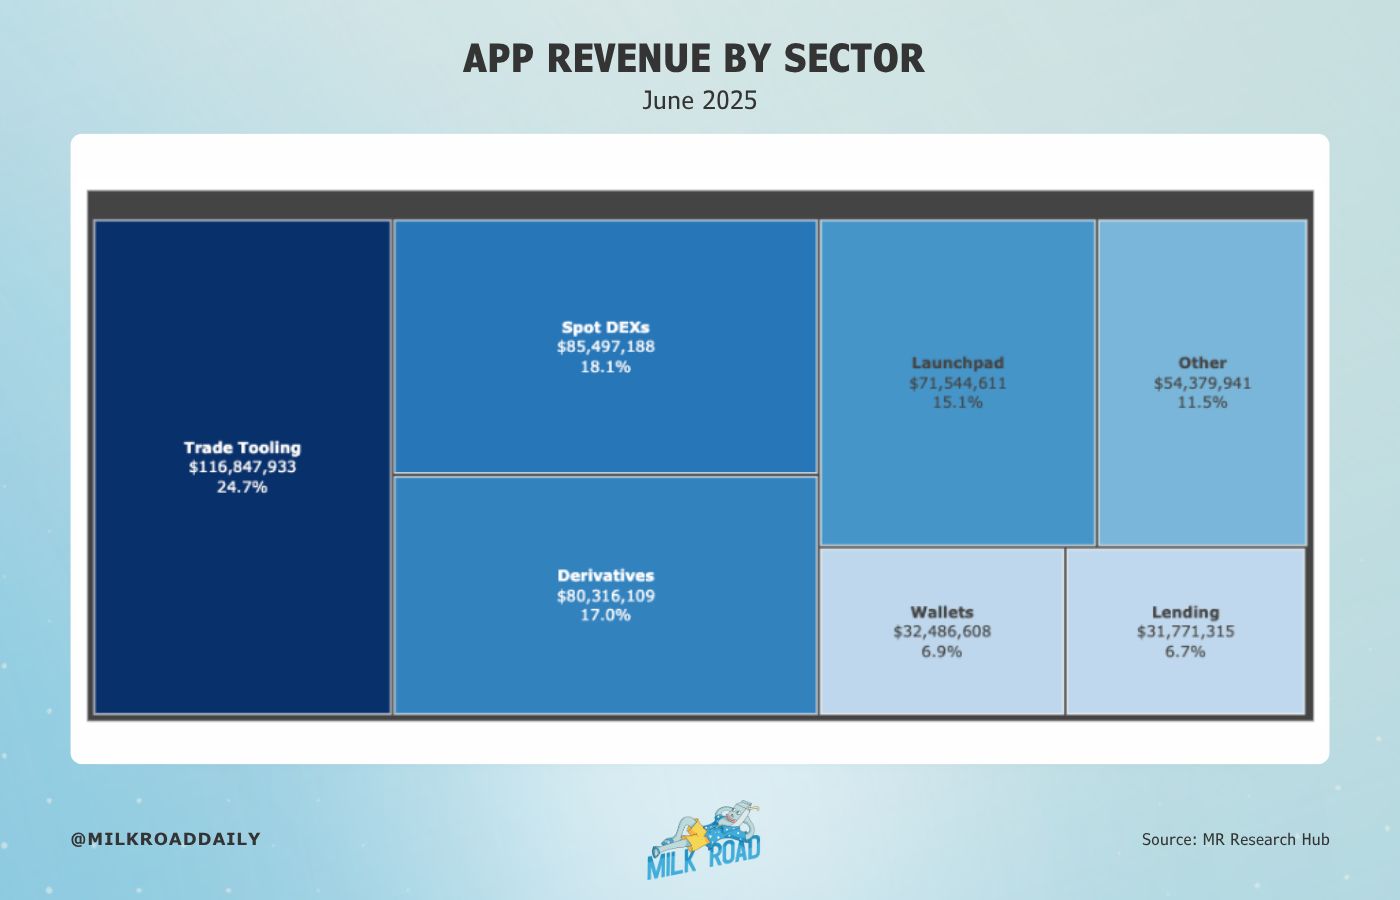
Source: MR Research Hub
In June 2025, total app revenue hit $473 million — that’s a pretty big number.
We can also spot which sectors made the most money by checking out their share of the total revenue.
Some of the top categories might surprise you, while others are more expected. So let’s dive in and break them down one by one.
Side note: this chart surprised us too. And we’re pretty sure it’s going to look very different over the next 3 to 5 years. But let’s save our own projections for the end.
We’re kicking things off with the biggest category at the top, then working our way down the list.
Uh, Oh… 😧 The rest of this report is exclusive to Milk Road PRO members!
Already a PRO member? Log in here.
WHAT’S LEFT INSIDE? 👀
The sector we want exposure to most right now
Why wallets are one of the most slept on app categories in the space
The decentralized exchange that’s trying to out-do Fintech giants like Coinbase
Upgrade your subscription today to unlock access to all of the milky insights above, PLUS:
Weekly reports to help you manage investments, allocate capital, take profits, and stay ahead in crypto 📊
Weekly “Where Are We In The Cycle?” indicators to help you spot the bull market top before it’s too late 📈
Access to the PRO Community, where the Milk Road crew & 1000s of fellow PROs talk crypto. 🫂
Already a PRO member? Log in here.
WHAT PRO MEMBERS SAID LAST WEEK: