- Milk Road Crypto
- Posts
- MR PRO | The Real Reason For Crypto Cycles
MR PRO | The Real Reason For Crypto Cycles
How Global Liquidity Impacts Crypto
GM PRO DOers! 😎
You may have noticed that crypto moves in massive cycles?
Or, if you’re new here, you may have heard us talk about past crypto cycles or refer to the current “cycle” we're in.
Understanding these cycles is probably the most important thing you can do as an investor or builder in crypto.
These cycles are not just about price, but also user and developer adoption, liquidity and investment in the space and so much more.
Timing these cycles properly is the key to capitalizing on the opportunity of crypto.
Today I’m going to teach you what causes these cycles and how you can stay ahead of them.
Here’s a great chart that showcases the crypto cycles of the past.
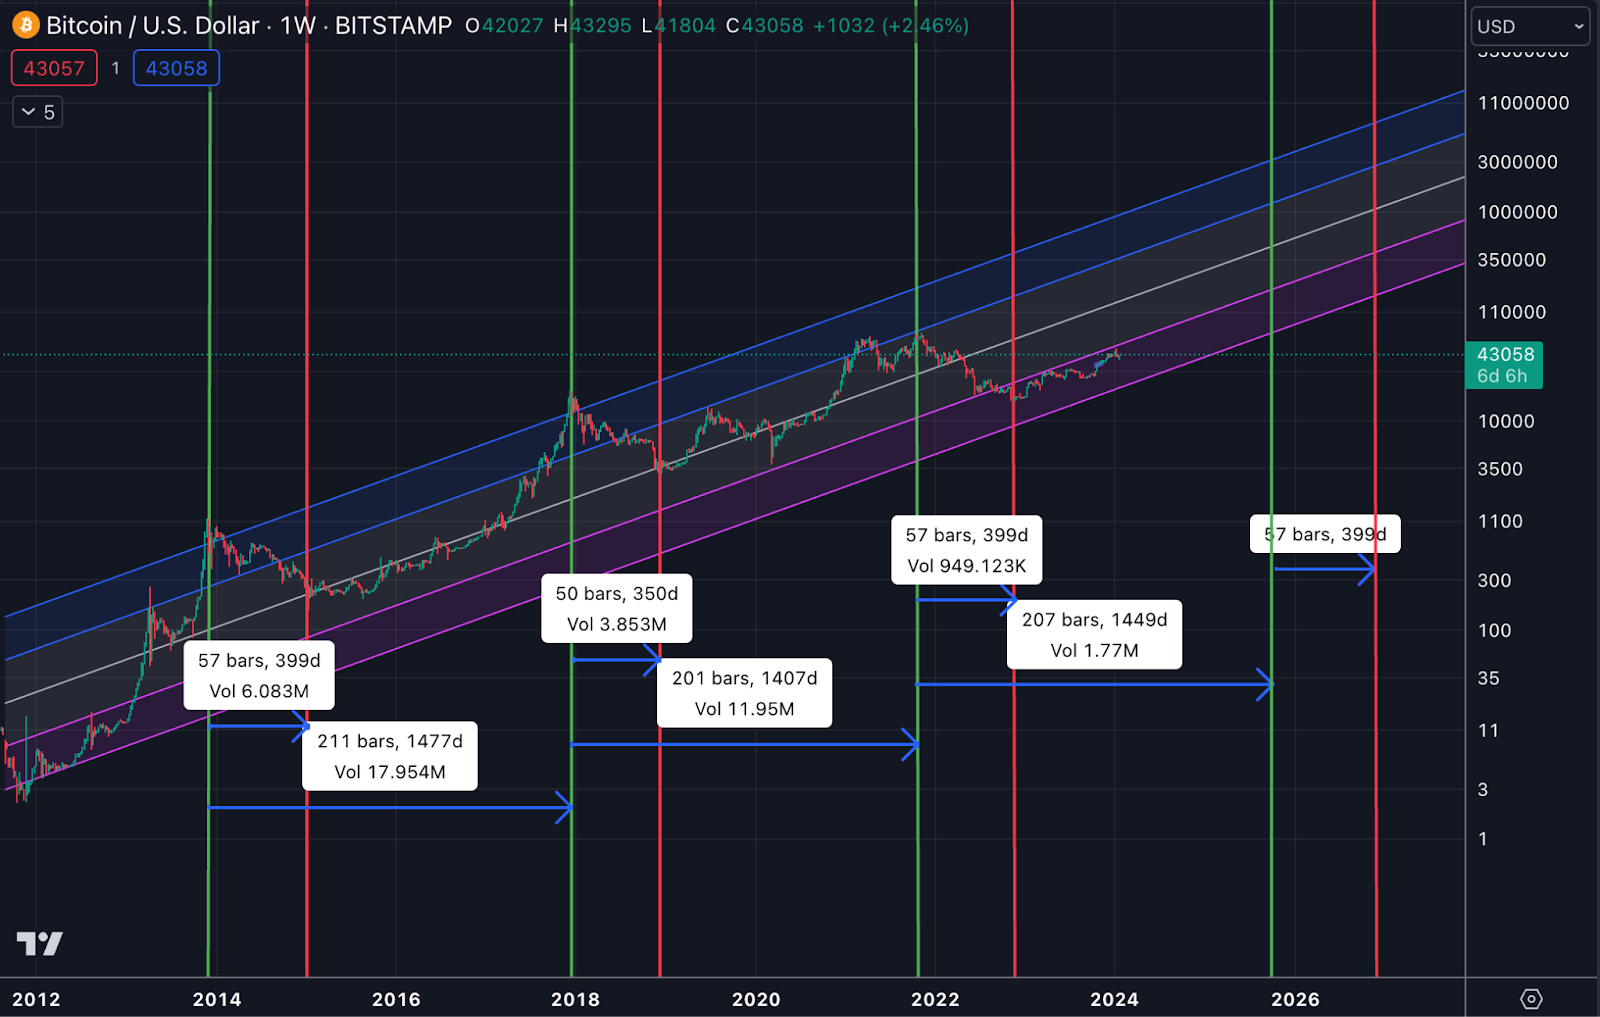
They are oddly similar, aren’t they?
Each cycle lasts about 4 years in total
The top (green line) to the bottom (red line) of the last 3 cycles have lasted 57 weeks, 57 weeks and 50 weeks
The bottom to the top of the last 2 cycles lasted 211 weeks and 201 weeks.
Even the specific chart patterns of each cycle look oddly similar.
Here’s the first cycle of Bitcoin which topped in 2014…
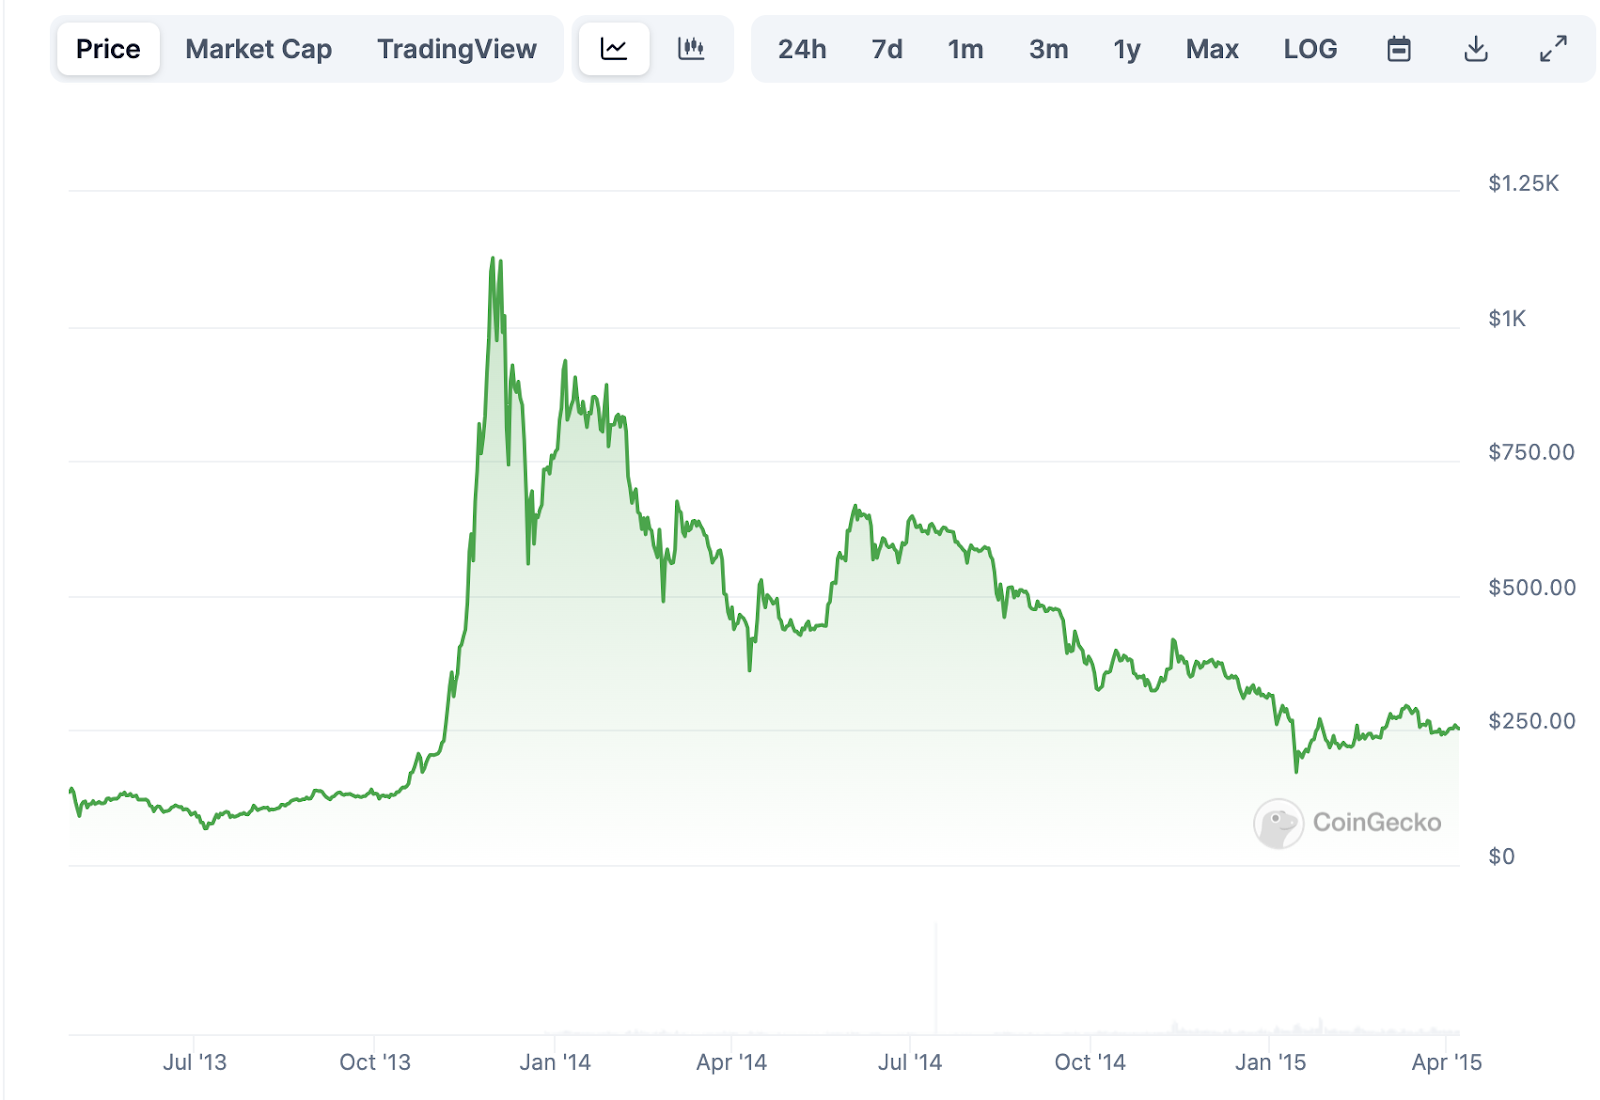
Here is the second cycle of Bitcoin which topped in 2017..

And the 3rd cycle which topped in 2021.
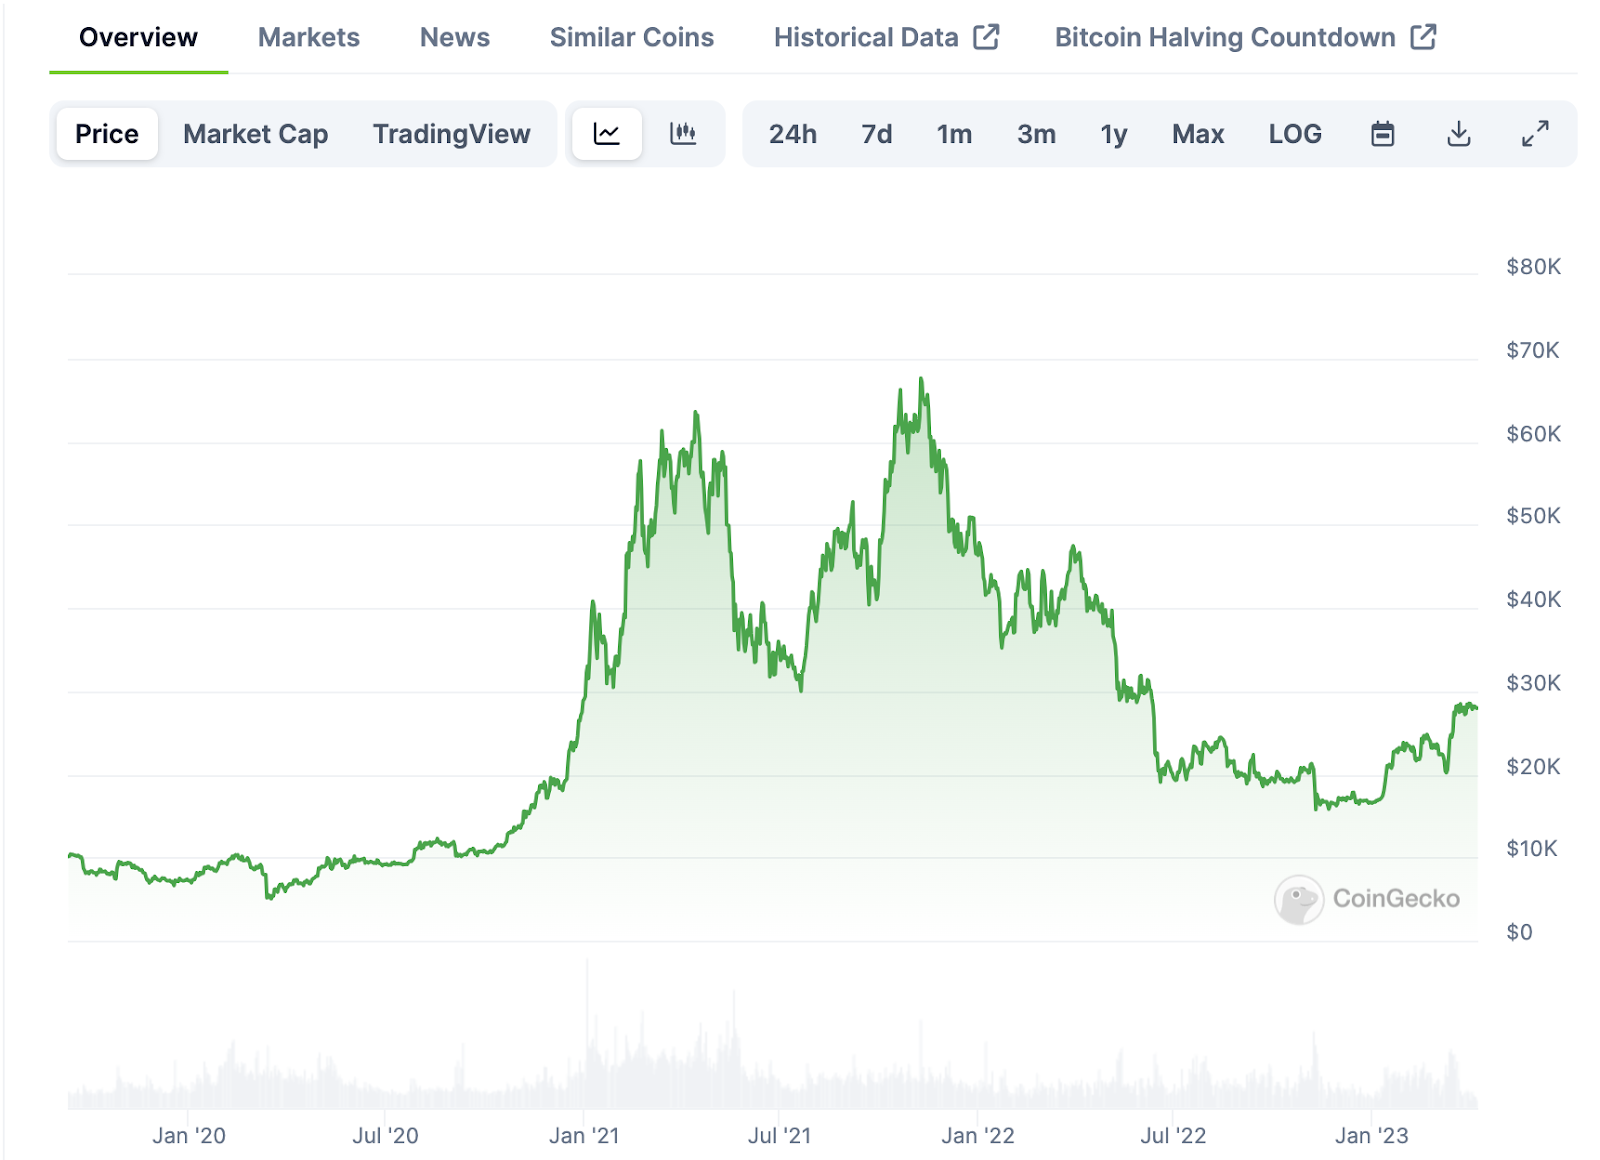
The latest cycle looks a bit different as it has a double top, however this can be explained by FTX, 3AC and other now bankrupt/fraudulent companies propping up the market with leverage from funds that didn’t actually exist.
Otherwise, it likely would have looked very much the same.
So what gives? How can this be possible?
The Bitcoin Halving? 🤔
Well, many people in this space consider these cycles as a result of the Bitcoin halving, which occurs every 4 years (I don’t by the way, so read on to understand what I do think is the reason).
The Bitcoin Halving is part of the Bitcoin protocol code whereby the rewards (aka inflation) of Bitcoin is cut in half every 4 years.

It would make sense that if you cut the amount of supply entering the market in half, while maintaining the same amount of demand, the price has no choice but to go up.
If we look at the chart below, the blue lines represent the halving and we can see that price tends to go up well before the halving event every cycle.
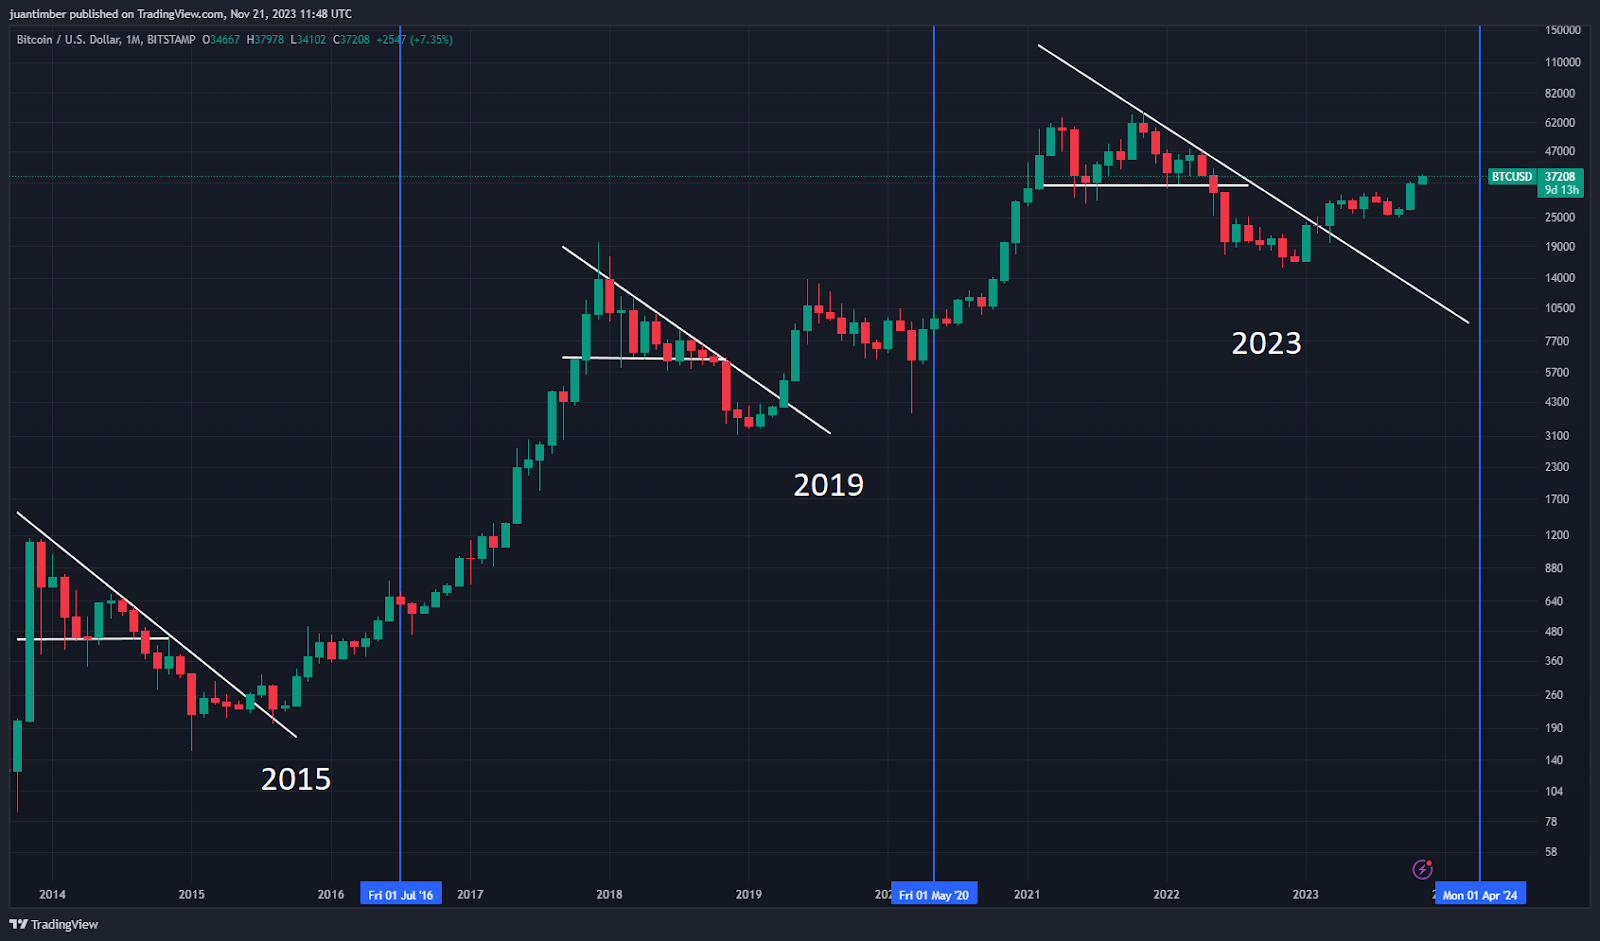
This could be explained by the fact that the halving is baked into the Bitcoin protocol code, so anyone “in-the-know” knows the exact date of the halving well in advance (...we already know this for the next 100 years) and can front-run the event.
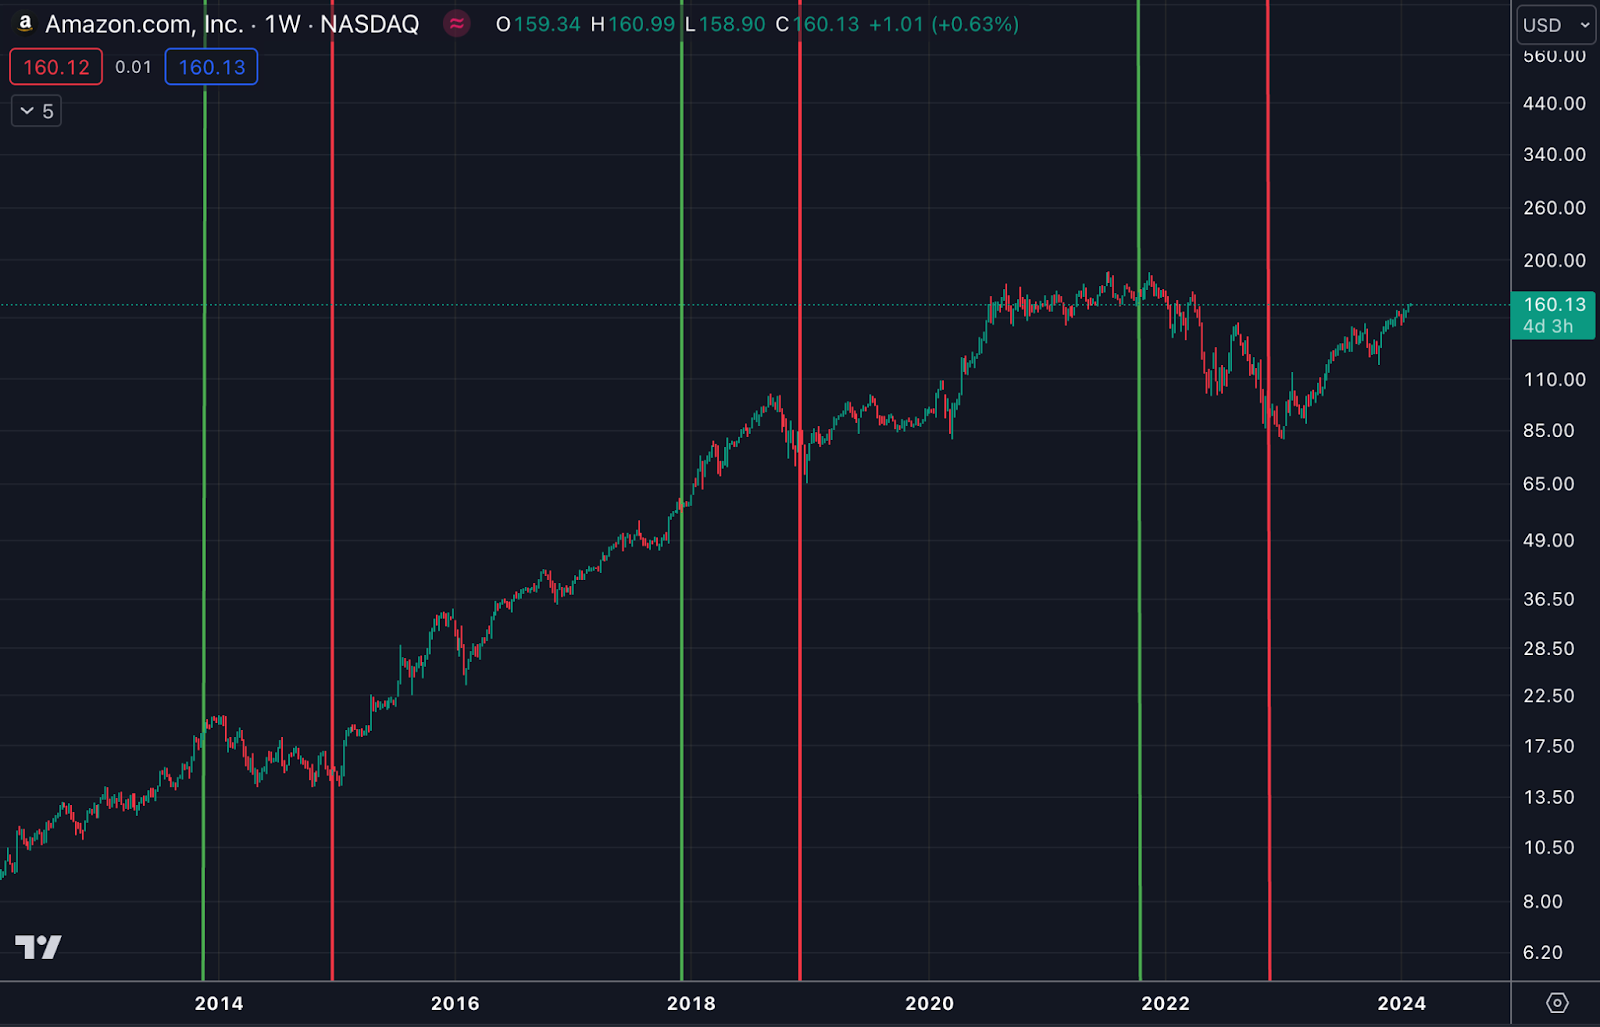
But if the Bitcoin halving was causing these cycles… Why then would these cycles also exist in a stock like Amazon? (the green and red lines are copy/pasted from the Bitcoin chart)
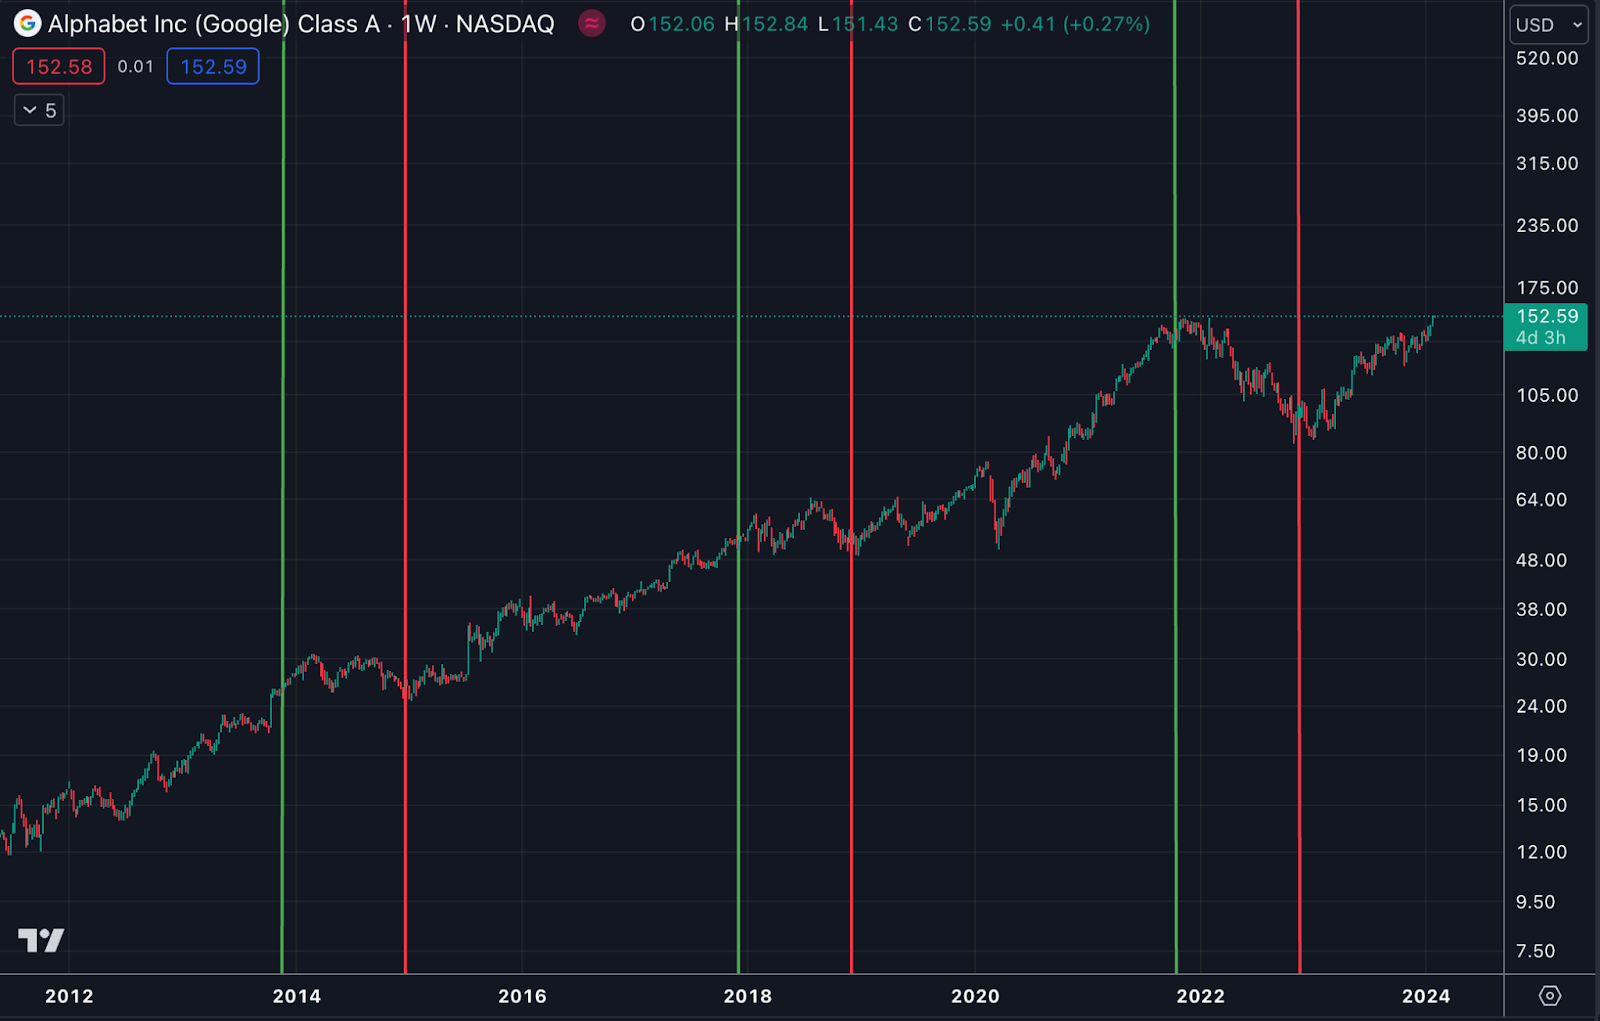
Or Google?
Or the entire technology sector (NASDAQ)?

While the charts above are not exactly following the tops and bottoms of Bitcoin, they are very similar.
Also, with each cycle that passes they become more and more accurate. The last cycle’s tops and bottoms are identical across Bitcoin, Amazon, Google and the entire NASDAQ.
So, is Bitcoin’s halving controlling the entire technology sector? Of course not.
I believe the Bitcoin halving is simply a coincidence (though it likely does have some factor in the large upside Bitcoin has in these cycles vs. tech stocks) and these cycles in crypto and technology in general are occurring from a completely different factor.
That factor is Global Liquidity.
Global Liquidity Cycles ♻️
Subscribe to Premium to read the rest.
Become a paying subscriber of Premium to get access to this post and other subscriber-only content.
Already a paying subscriber? Sign In.
A subscription gets you:
- • Full access to the Milk Road Portfolio & weekly updates to see what we’re actively investing in
- • NEW: Unlimited access to the Milk Road PRO Token Center with token ratings and insights. 🔓
- • Weekly “Where Are We In The Cycle?” indicators to help you spot the bull market top before it’s too late 📈
- • Weekly reports that help you spot early trends, navigate the markets by limiting risk & catch those sweet cha-ching moments 💰
- • Access to the PRO Community, where the Milk Road crew & 1000s of fellow PROs talk crypto. Don’t miss the monthly live events! 🫂
- • 50% OFF the Crypto Investing Masterclass 📚️