- Milk Road Crypto
- Posts
- MR PRO | Price Predictions for $BTC, $ETH & $SOL
MR PRO | Price Predictions for $BTC, $ETH & $SOL
Aiming to Identify the Bull Market Top
GM PRO DOers! 😎
Today we’re going to have a bit of fun. 🎉
We’re going to predict the top of $BTC, $ETH, and $SOL this cycle.
We’re going to use charts, historical data as well as asset comparisons to build a case for the potential peak price of these 3 major assets in the coming bullrun. ⛰️
As many of you know, crypto has historically moved in 4-year cycles. These cycles are oddly similar in timeframes, market structure, and even prices from one asset to another.
It’s actually extremely weird how similar each cycle is, but it gives us some great insights for predicting what might happen next.
History never repeats, but it often rhymes. 🎶
What this means is that we can use historical cycles and data to build our thesis around future cycles, but we can’t expect them to be perfectly accurate.
🚨 PSA: Anyone who tells you they can predict cycle tops is wrong. There is no perfect metric, chart, or data point that can do that. Don’t get caught up in the hype!
In today’s report, we are going to assume some numbers and create potential ranges for $BTC, $ETH, and $SOL, but that does not mean these will actually happen.
Part of this is simply just a fun exercise, but part of this is also about zooming out and building a bit of a framework for the coming cycle, a starting point if you will.
It’s always great to create a thesis around your investments and then adapt and improve upon this as more data becomes available to you over time.
Once these assets pass their previous all-time highs, all technical analysis for specific prices go out the window. When we hit price discovery, that’s when the real fun begins.
But let’s get ahead of that and try to frame where we might go next.
LFG. ⏬
Crypto Cycles and Timeframes ♻️
First, let’s wrap our heads around the crypto cycles.
It is often said that crypto moves in 4-year cycles because of the Bitcoin Halving, an event that occurs every 4 years in the Bitcoin mechanism, which cuts its inflation by 50%.
This supply cut appears to be a catalyst for each cycle. Below is a simple chart showing the price cycles of Bitcoin with a blue line representing each Bitcoin Halving.
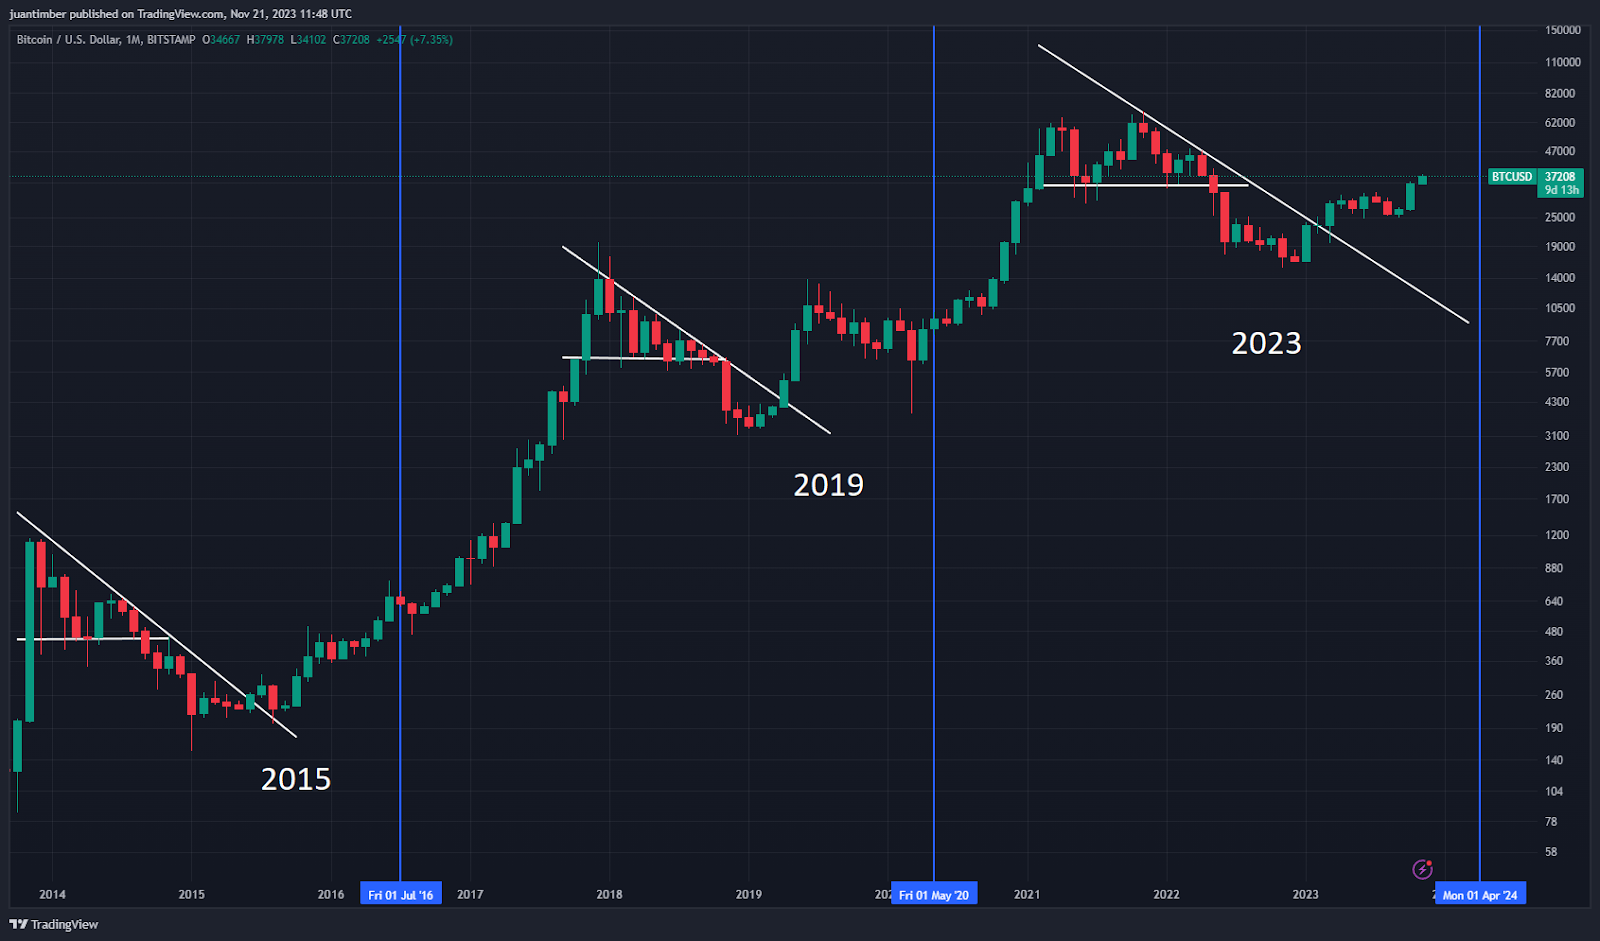
Here is another way to look at these cycles of Bitcoin with a green line signifying the tops and a red line signifying the bottoms of each cycle.
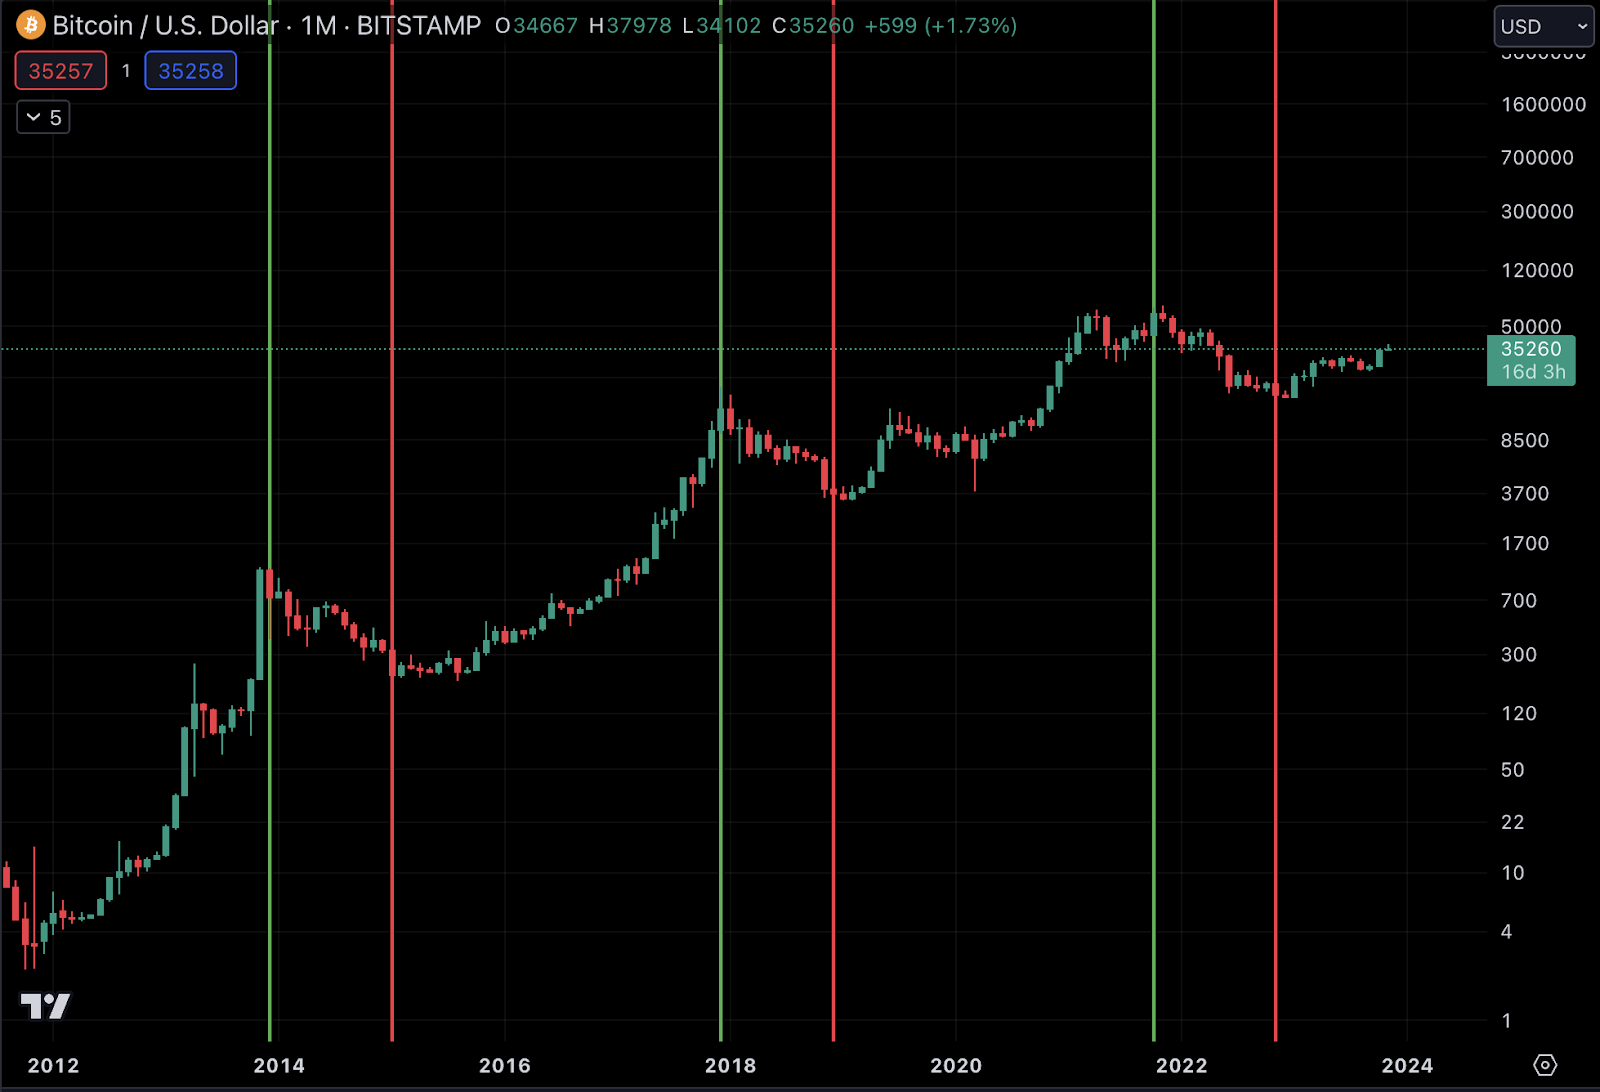
It’s best to use Bitcoin as a starting point since it has had the most complete cycles versus any other crypto asset.
Interestingly, if I show the chart of YOY (Year Over Year) change in global liquidity (the creation and destruction of new money), the tops and bottoms of the chart above match the one below almost perfectly, for every cycle!
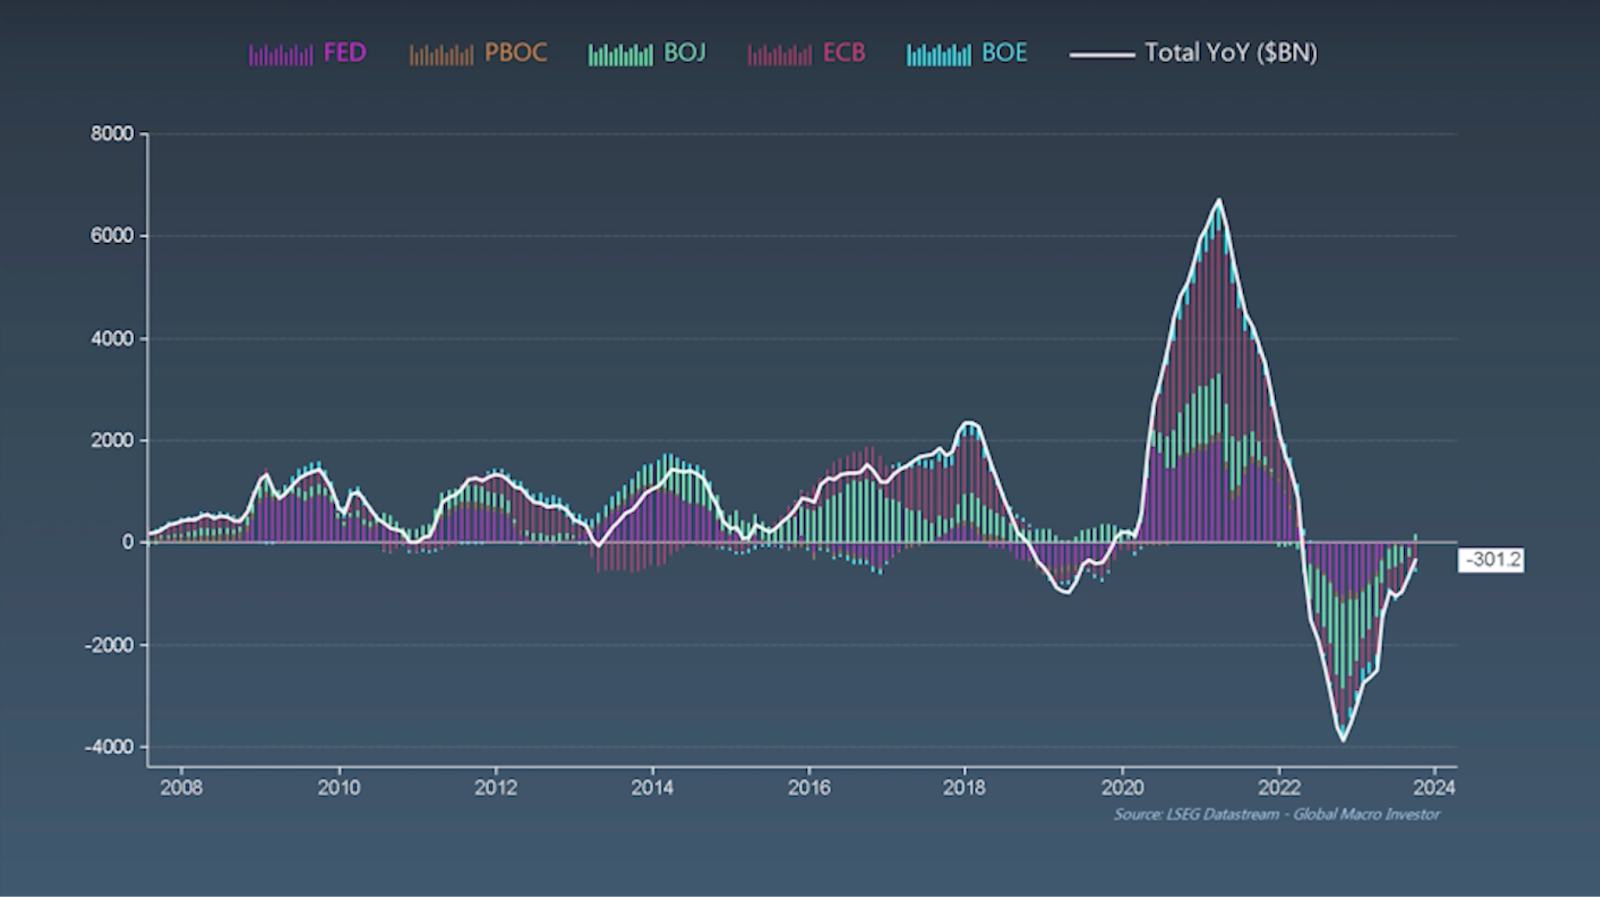
The tops on both charts are early 2014, late 2017, and late 2021. With the bottoms being early 2015, late 2018 and late 2022.
While the Bitcoin halving is a great meme, I believe global liquidity is the real catalyst creating these cycles.
This is important to understand as we can use macro indicators to predict liquidity cycles, which would thus allow us to better predict the timeframe and severity of the coming crypto cycle.
Again, this is why the predictions below are simply a starting point that we will build on throughout this cycle.
To begin predicting prices, let’s first start by predicting the length of the coming cycle, since we have past data to help determine this.
Using the lines on the chart above, we can measure the distance between the tops and bottoms of Bitcoin cycles, as well as the top to the next top of a cycle.
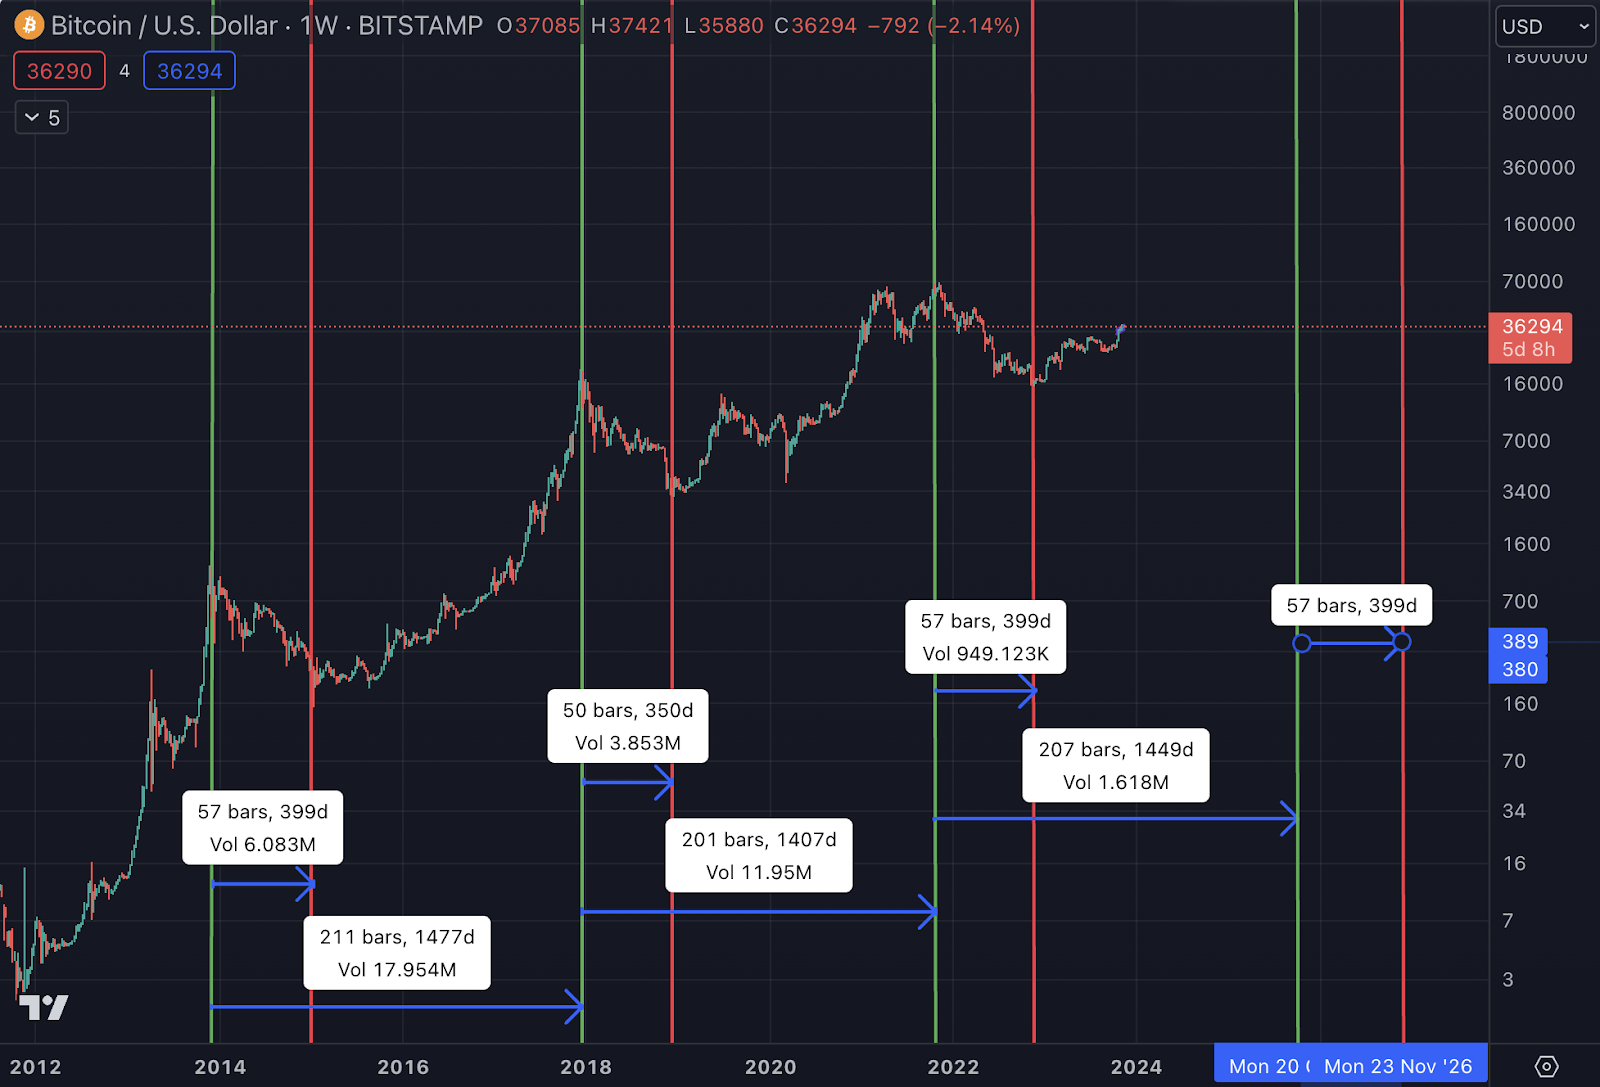
Interestingly, the top to bottom of Bitcoin cycles are almost identical in terms of length. In 2014, it was 399 days from top to bottom, in 2018 it was 350 days and in 2022-23, it was once again 399 days. 🤯
For the top to top of each cycle, we only have 2 relevant cycles to look at, but they are just days apart as well. From 2014 to 2018, it was 1477 days apart, and from 2018 to 2021, it was 1407 days apart.
In the chart above, I have added a potential top and bottom for the next cycle. For the top, I used the average days between the tops of the past two cycles and for the bottom I used 399 days after the projected top, since we’ve already had that same number 2 out of 3 times in the past.
Now, we have an assumed date of October 1st, 2025 for the top of Bitcoin in the next cycle and a bottom of November 1st, 2026.
This brings us to our first means of projecting the cycle tops…
Linear Regression Channel On A Logarithmic Scale 📈
We will use multiple ways of predicting the top of this cycle, but here is one that is very simple.
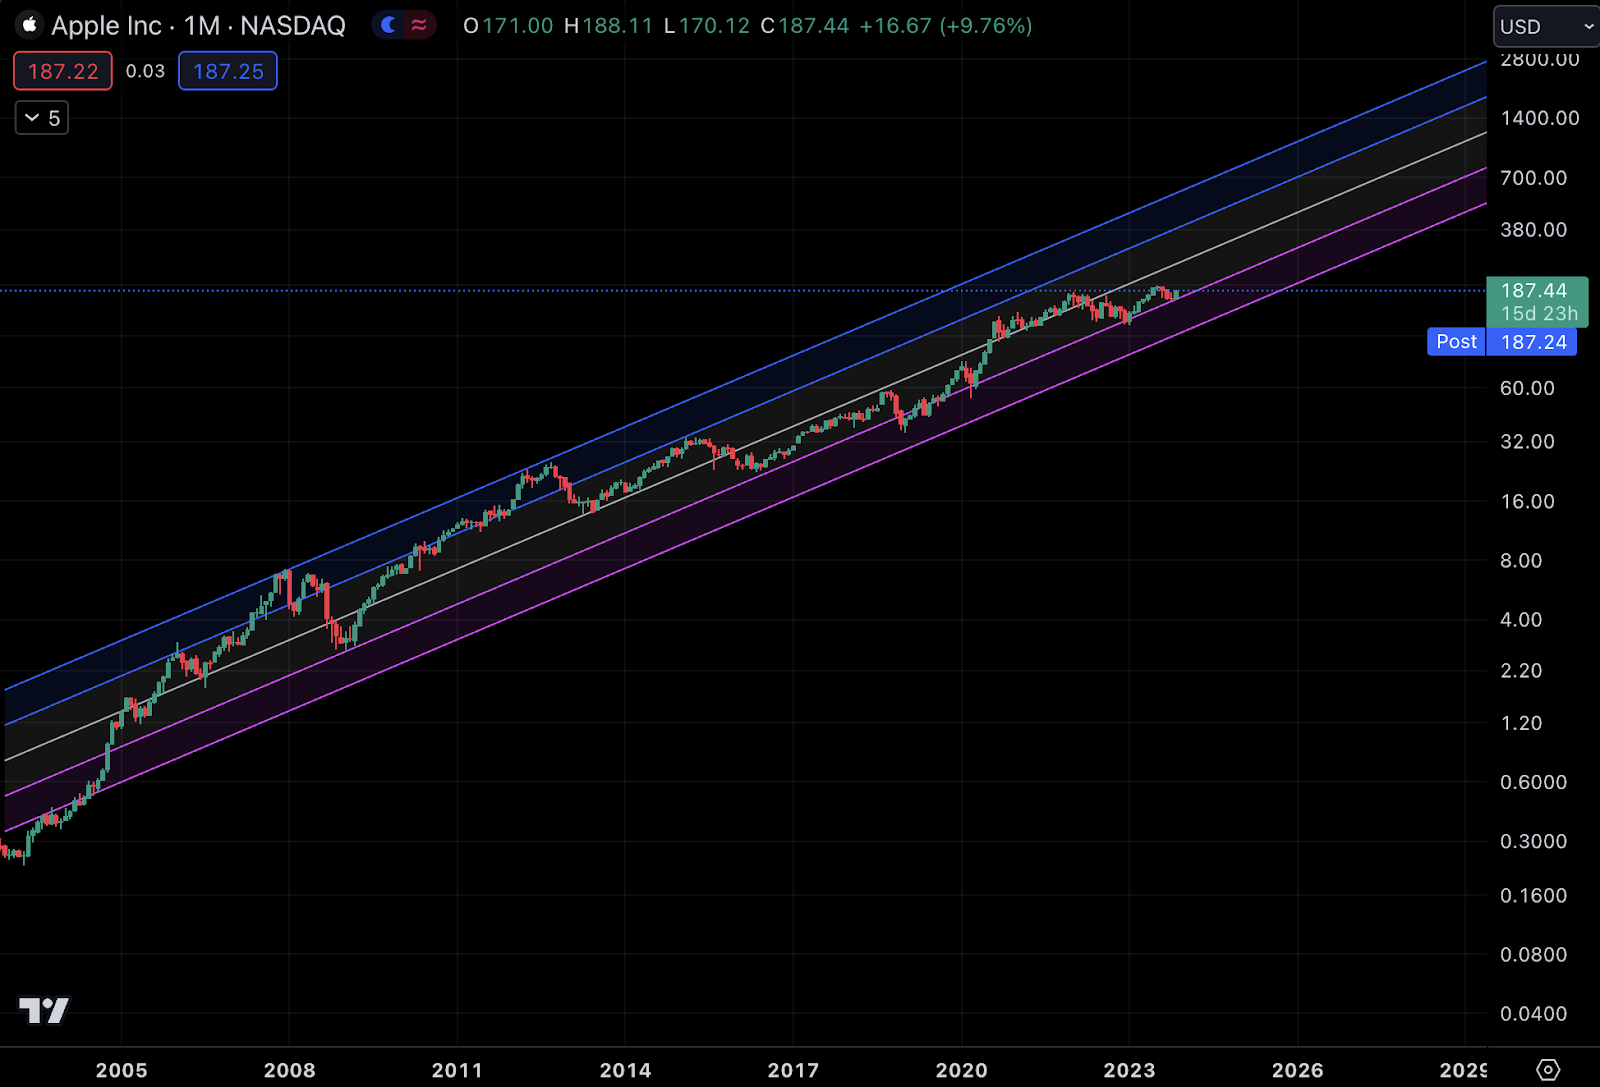
Technologies with network effects have exponential growth and thus should be viewed on a logarithmic scale (1, 10, 100, 1000, etc.) rather than a linear scale (1, 2, 3, 4, 5, etc.) when looking at them long term.
This helps to better conceptualize these technologies’ potential growth, as humans often struggle to think in exponential terms. This is why so many investors struggled to buy and hold other exponential technologies like Apple, Amazon, Google over the last 2 decades (they went up too much!)
Each of these technologies with network effects, so long as those network effects don’t break, follows a similar growth path along an exponential chart.
This can be mapped out using a linear regression channel on a log scale.
Here is an example of Apple following this channel since 2002. I could show the same thing for Google, Meta, Amazon, Microsoft, Tesla, and many other network-based technologies. If you want to learn more about this check out a previous PRO report on this topic here.
Here is Bitcoin on a log scale with a regression channel that has our lines projecting the top and bottom of Bitcoin this cycle.
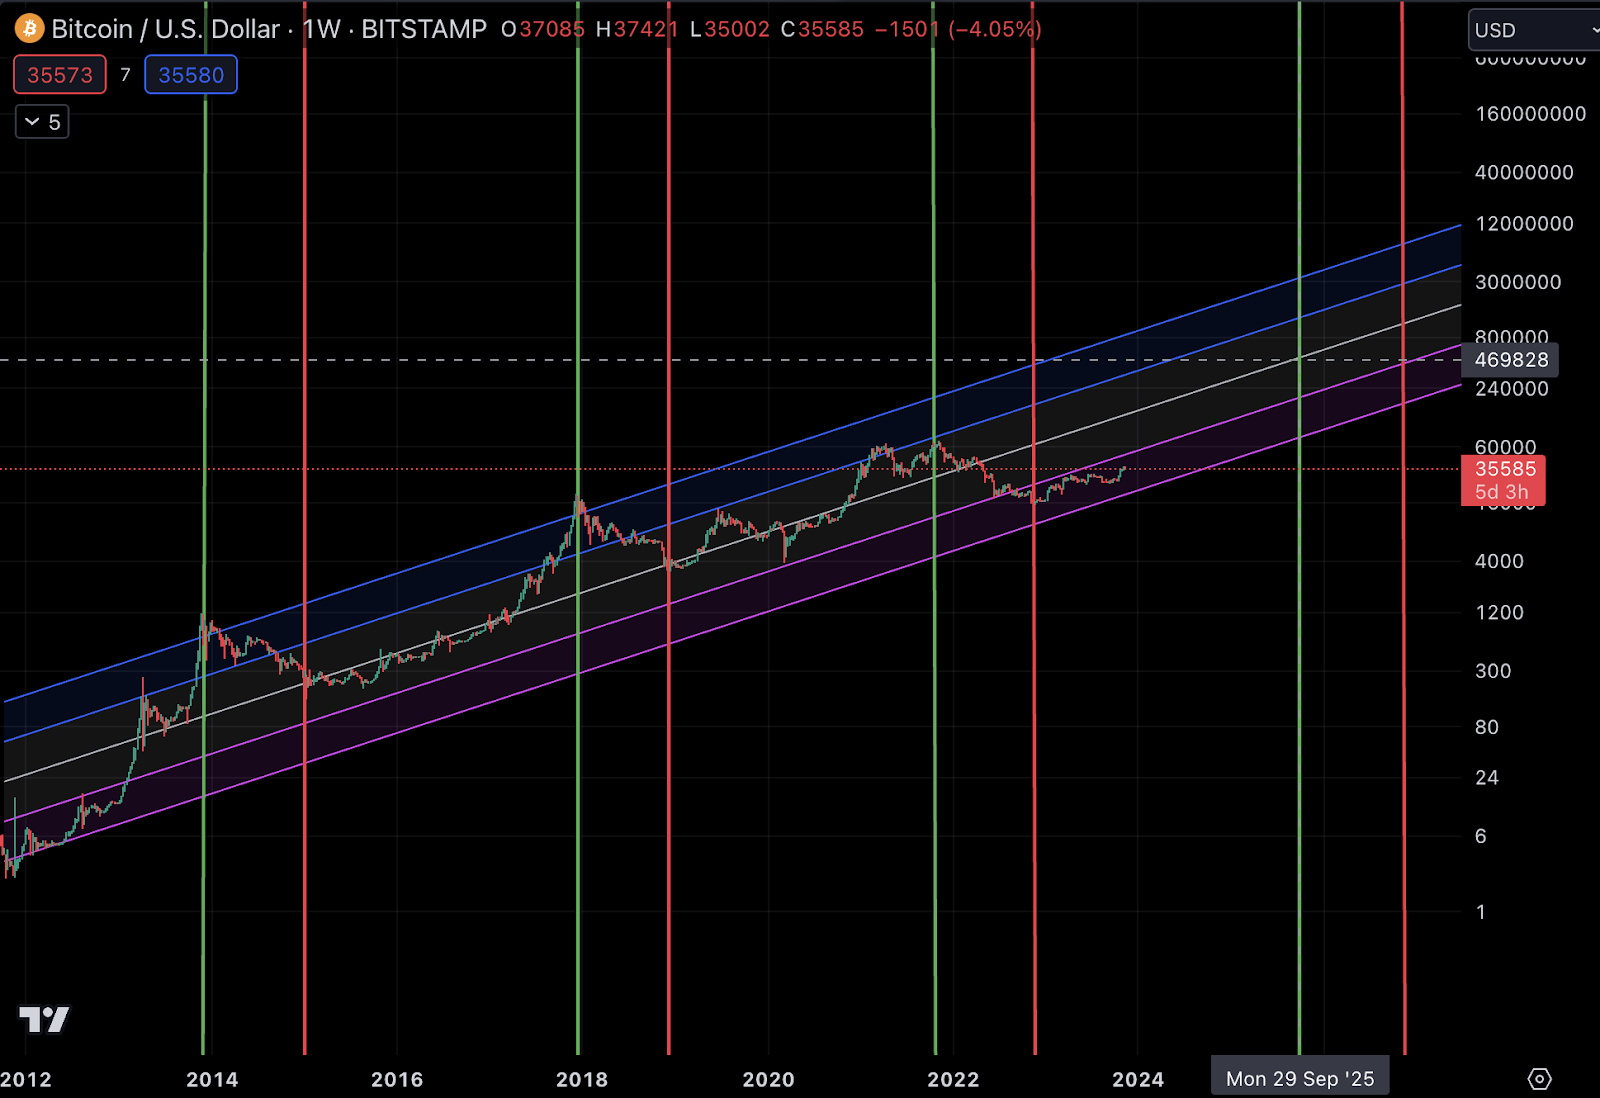
In the first 2 cycles, Bitcoin reached 2 standard deviations overbought (the top blue line) from the trendline (the gray line). In the last cycle, Bitcoin reached 1 standard deviation overbought from the trendline.
If Bitcoin reaches 1 standard deviation overbought from the trendline at the projected top of this cycle, that would give us a $BTC price of $1.2 million.
But this bear market was also the first time Bitcoin went below 1 standard deviation oversold (the 1st purple line), so maybe BTC is slowing down and can only reach the trend line.
That would give $BTC a price of $469k.
And even if Bitcoin remained 1 standard deviation oversold for the entire cycle, it would still give us a price of $188k.
So let’s go with a range of $188k - $1.2 million. That’s a 2.7x - 17x from the top of the last cycle.
Ok, now let’s check out Ethereum.
Subscribe to Premium to read the rest.
Become a paying subscriber of Premium to get access to this post and other subscriber-only content.
Already a paying subscriber? Sign In.
A subscription gets you:
- • Full access to the Milk Road Portfolio & weekly updates to see what we’re actively investing in
- • NEW: Unlimited access to the Milk Road PRO Token Center with token ratings and insights. 🔓
- • Weekly “Where Are We In The Cycle?” indicators to help you spot the bull market top before it’s too late 📈
- • Weekly reports that help you spot early trends, navigate the markets by limiting risk & catch those sweet cha-ching moments 💰
- • Access to the PRO Community, where the Milk Road crew & 1000s of fellow PROs talk crypto. Don’t miss the monthly live events! 🫂
- • 50% OFF the Crypto Investing Masterclass 📚️